
What Is the Best Treatment Plant in China?
What Is the Best Treatment Plant in China? There is no reliable single answer without defining “best.” A municipal wastewater Treatment Plant may excel at removing pollutants, while another uses less energy or recovers more resources. Any fair comparison needs clear criteria, recent operating data, and the plant’s local context—not just a striking design or a high-capacity label.
Water researcher Peter H. Gleick has written, “The health of our waters is the principal measure of how we live on the land.” That principle helps frame this comparison. Look beyond the concrete tanks: check effluent quality, energy use, sludge handling, monitoring, and performance during heavy rain. Consider whether reported results are independently verified and sustained over time. Numbers matter. So does transparency.
This article will examine leading Chinese facilities through those practical measures, while distinguishing documented facts from promotional claims. It will also consider differences in treatment goals, climate, and the quality of incoming wastewater. A plant built for one city may not suit another. Some evidence may be incomplete, and rankings can hide trade-offs. That deserves scrutiny. The aim is not to declare a universal winner, but to identify which plants perform well, by what measures, and what readers should verify before trusting a “best” claim.
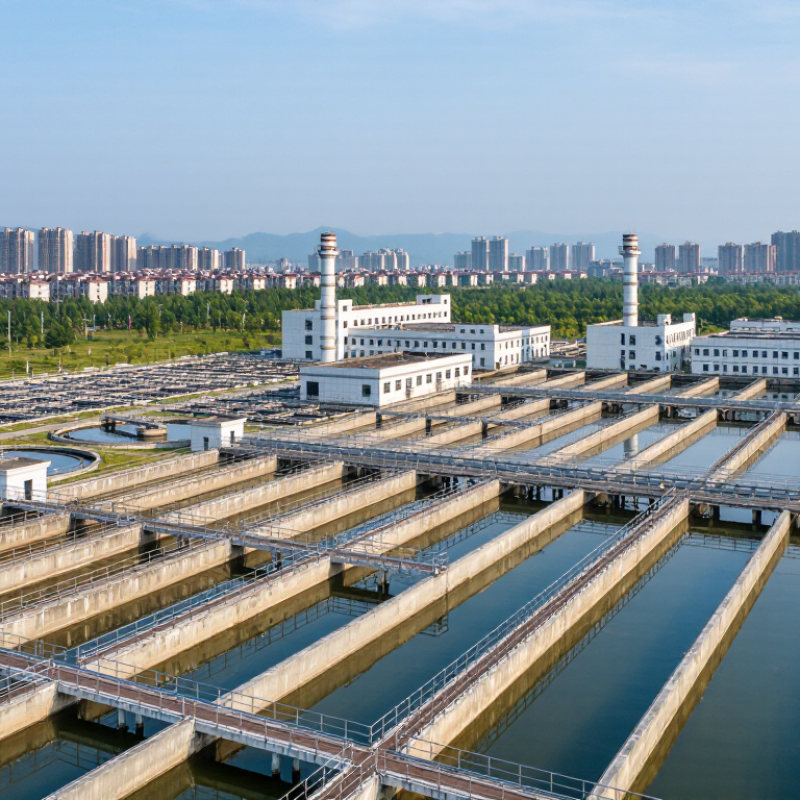
What Types of Treatment Plants Operate in China?
China’s treatment plants serve different purposes, so “best” depends on the water source and local needs.
Municipal wastewater plants treat sewage from homes, shops, and public buildings. Screens catch wipes and plastic, while settling tanks separate grit and solids. Biological reactors use microbes to reduce organic pollution, followed by disinfection before discharge or reuse. Cities near sensitive rivers and lakes may also remove nutrients. Smaller towns may use compact systems; dense urban districts need greater capacity and careful odor control. Scale matters.
Industrial wastewater plants are designed around a facility’s actual effluent, which may contain salts, oils, dyes, or metals. They can combine chemical treatment, filtration, membranes, and biological processes. One recipe rarely fits every site. Drinking-water plants work in the opposite direction, clarifying and disinfecting river, reservoir, or groundwater before distribution. Sludge-treatment facilities manage the solids left behind through thickening, digestion, and dewatering. Reuse and desalination plants also operate in water-stressed areas, though energy use and concentrate management deserve attention. No type wins everywhere.
A site visit can reveal details a diagram misses, such as changing inflows, maintenance access, and calibration routines. I would be cautious about ranking plants by one headline figure; dependable performance takes monitoring over time.

How Is “Best” Defined for a Treatment Plant?
“Best” should mean reliable public-health protection, not the largest capacity or newest equipment. A strong treatment plant consistently removes pollutants, meets discharge limits, and handles peak flows without bypasses. It should also use energy and chemicals efficiently, manage sludge safely, and publish monitoring results that residents can understand.
Measure outcomes over time. The UN-Water and WHO report Progress on Wastewater Treatment: 2024 Update estimates that 42% of household wastewater worldwide was not safely treated in 2022. That global figure is not a scorecard for Chinese plants, but it shows why actual treatment performance matters. Useful comparisons include effluent quality, compliance rates, operating costs per cubic metre, energy use, and resilience during heavy rain. Numbers matter. Site conditions matter, too: a plant serving a coastal city faces different salinity and flow challenges from one treating inland industrial wastewater. I would also question rankings based on one inspection or a single annual average. A low average can conceal short pollution spikes. The fairest assessment combines independently verified data, year-round performance, transparent reporting, and the receiving river’s condition.
What Is the Best Treatment Plant in China? - How Is “Best” Defined for a Treatment Plant?
There is no single “best” treatment plant for every location. A sound comparison considers regulatory compliance, treatment performance, resource efficiency, reliability, environmental impact, and the needs of the communities served. The figures below are reference criteria, not ratings of any specific plant.
| Evaluation dimension | What to measure | Reference data or benchmark | How it helps define “best” |
|---|---|---|---|
| Discharge compliance | Effluent chemical oxygen demand (COD), biochemical oxygen demand (BOD5), suspended solids (SS), ammonia nitrogen, total nitrogen, and total phosphorus | China’s GB 18918-2002 Grade 1A limits include COD ≤ 50 mg/L, BOD5 ≤ 10 mg/L, SS ≤ 10 mg/L, ammonia nitrogen ≤ 5 mg/L (≤ 8 mg/L when water temperature is below 12°C), total nitrogen ≤ 15 mg/L, and total phosphorus ≤ 0.5 mg/L (≤ 1.0 mg/L below 12°C). | A strong plant meets the applicable discharge permit consistently. Local requirements or receiving-water targets may be stricter than these national Grade 1A limits. |
| Stable treatment performance | Routine and continuous effluent monitoring; frequency and duration of permit-limit exceedances; performance during high-flow or high-load periods | Compare monitoring results with the plant’s discharge permit and the applicable national or local limits over a representative operating period. | Consistent compliance is more meaningful than a single unusually good sample. |
| Pollution-load reduction | Influent and effluent concentrations, treated flow, and pollutant mass removed per day | Calculate removal using paired influent and effluent data; report both concentration-based removal and mass removed, for example in kg/day. | Shows the actual pollution burden removed, while accounting for changes in incoming wastewater strength and flow. |
| Energy efficiency | Electricity use per volume of wastewater treated (kWh/m³), with flow, treatment level, and site conditions reported | There is no single universal energy limit suitable for every plant. Compare plants with similar capacity, treatment requirements, influent conditions, and topography. | Lower energy use is beneficial when equivalent treatment quality and reliability are maintained. |
| Water reuse | Reclaimed-water volume, share of treated effluent reused, and quality for the intended use | Assess reuse against the applicable Chinese reclaimed-water standard for its intended purpose, such as landscaping, industrial use, or urban non-potable use. | Useful reuse can reduce demand for freshwater, provided water quality and public-health requirements are met. |
| Sludge management | Sludge quantity, stabilization and dewatering performance, final destination, and documented compliance | Track sludge from production through treatment and final use or disposal; verify the relevant requirements for the chosen route. | Responsible handling prevents pollution from being transferred from wastewater to an inadequately managed residual. |
| Operational resilience | Unplanned downtime, bypass or overflow events, equipment availability, and response to storms or power interruptions | Use operating logs and incident records; compare plants serving similar populations and facing similar risks. | A high-performing plant continues to protect public health and receiving waters during difficult operating conditions. |
| Cost and affordability | Operating cost per cubic metre, staffing, maintenance, and lifecycle cost | Use audited operating data and include comparable cost boundaries; separate operating costs from construction costs where possible. | The best option delivers the required environmental performance at a sustainable cost over its useful life. |
| Overall assessment | A transparent, weighted score across compliance, stability, resource use, resilience, and cost | Set weights before comparing plants and publish the data period, calculation method, and any missing data. | “Best” depends on local needs: a plant serving a water-scarce city may prioritize reuse, while another may prioritize nutrient removal or flood resilience. |
Note: GB 18918-2002 limits are national reference values for urban municipal wastewater treatment plant discharge. The applicable permit, receiving-water requirements, and local standards should be checked for each plant.
Which Chinese Treatment Plants Are Widely Recognized?
Which Chinese treatment plants are widely recognized? For municipal wastewater, recognition usually reflects scale, reliable operation, and transparent environmental monitoring—not a single national ranking. Beijing’s Gaobeidian plant and Shanghai’s Bailonggang plant are frequently cited as large urban reference facilities. Their importance is practical: treating heavy daily flows while controlling odors and handling sludge near populated areas. The details matter. A strong design can still underperform when maintenance or monitoring slips.
The Ministry of Housing and Urban-Rural Development’s 2022 Urban Construction Statistical Yearbook reports 2,897 urban wastewater treatment plants nationwide, with combined capacity above 210 million cubic meters per day. It also records a 98.1% urban wastewater treatment rate. These figures describe the system, not the performance of every facility. The World Bank’s work on China’s urban wastewater sector also emphasizes that expanding treatment alone is not enough; reliable operation and water reuse matter. For a fair comparison, check published effluent data, seasonal performance, energy use, and reuse rates. Rankings can miss the unglamorous part: consistent performance on an ordinary, rainy Tuesday.
What Is the Best Treatment Plant in China?
A useful starting point is to compare treated wastewater with China’s Class 1A discharge limits.
The chart shows selected limits from China’s Discharge Standard of Pollutants for Municipal Wastewater Treatment Plants (GB 18918-2002). Lower limits indicate stricter discharge thresholds; actual performance depends on consistent compliance and local requirements. The ammonia nitrogen limit shown is 5 mg/L; the standard allows 8 mg/L when water temperature is at or below 12°C.
What Technologies Distinguish Leading Treatment Plants?
A leading treatment plant is distinguished less by a single machine than by how reliably its process works from inlet to outlet. At the headworks, screens and grit removal protect downstream equipment, while flow meters and online sensors track changing loads. Operators compare readings with laboratory samples, because a clean dashboard can still miss a poor sample. Small checks matter.
Biological treatment is often central. Carefully controlled aeration supplies oxygen to microorganisms, while nitrogen and phosphorus removal stages limit nutrients reaching rivers and lakes. Membrane filtration or advanced disinfection may provide extra barriers where reuse standards require them. These systems need skilled maintenance: membranes foul, sensors drift, and excess aeration wastes power. Technology helps, but does not replace good operation.
Strong plants also manage sludge and energy as part of the same system. Anaerobic digestion can reduce sludge volume and produce biogas; heat recovery and efficient pumps can cut energy demand. Real-time controls can adjust aeration as flows change after rain, but alarms need clear procedures and backup equipment. A useful comparison should examine outlet data, energy use, uptime, and maintenance records across seasons—not just installed capacity. I would also ask how the plant handles unusual influent. There is no perfect process.
How Can Treatment Plants Be Compared Across China?
Comparing treatment plants across China starts with the water each facility receives, not a national ranking. A plant in a dry northern city may face different demands from one handling monsoon flows in the south. Review daily and seasonal influent records, then compare them with applicable discharge limits and independently checked results. Look beyond design capacity. Ask how often treatment units are offline and whether performance stays steady during peak flows.
Operating evidence can reveal more than a tour of clean control rooms. Compare energy use per cubic meter, chemical consumption, sludge handling, and the frequency of unplanned maintenance. Request several years of monitoring data, not a single favorable month. Check whether sampling methods and reporting periods are consistent. Otherwise, comparisons can look precise while measuring different things.
Local fit matters. A plant serving industrial users may need stronger pretreatment controls than one handling mostly household wastewater. Visit the site, inspect flow meters and maintenance logs, and speak with operators about difficult operating days. Small details count: a clogged screen after a storm, or a backup pump that starts reliably. I would not call one facility “best” from one metric alone; even a well-run plant can have weak points.
Article Source:
At Premium PSU, we are specialists in designing and manufacturing power conversion systems for the industrial market. Our product range includes high reliability power supplies from 50W to 72kW.
PREMIUM PSU
C/ Dolors Aleu, 19-21, 2nd Floor
08908 – Hospitalet de Llobregat
Barcelona-SPAIN
t.+34 93 223 26 85